Control System Block Diagram
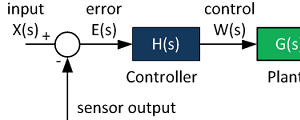
The figure below shows the most fundamental feedback control system. It contains a plant (typically a physical system that we would like to control), a controller (which shapes the input to the plant) and a summing junction that determines the error between the actual and commanded values. Feedback sensor is represented by its own transfer function as well.
The system signals are described in more detail:
X(s)
- X(s) is the command signal. Ideally, we wish for Y(s), the output signal, to be equal to X(s).
E(s) = X(s)-R(s).
- Error is the output of the summing junction and is the input to the feedback controller.
W(s) = E(s) H(s)
- Control signal, W(s), shows the output of the controller that drives the plant G(s). This could be an amplifier output, pulse-width modulated output, or a simple digital input if the whole system is digital.
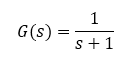
Y(s) = G(s) W(s)
- The Y(s) signal is the plant output. It is the response to the control signal W(s). The plant is modeled as a transfer function of arbitrary order, although the order is rarely higher than 3.
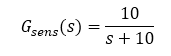
R(s) = Y(s) Gsens(s)
- This signal is the output of the sensor. Virtually all feedback signals are measured and scaled by sensors, such as pressure sensors, voltage and current sensors, torque meters, etc. Sometimes, the sensor dynamic is very fast and such the sensor transfer function can be neglected. In such case, Gsens(s) = 1. However, very often it is the sensor bandwidth that limits the bandwidth of the overall system.
- Voltage and current sensors have typically high bandwidth.
- Temperature sensors do have their own thermal constants and tend not to immediately respond to an abrupt temperature change.
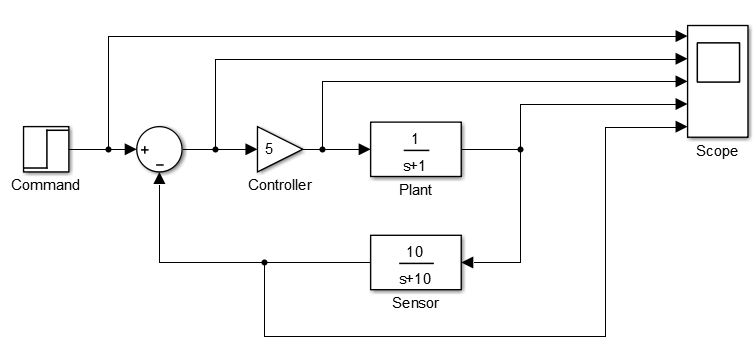
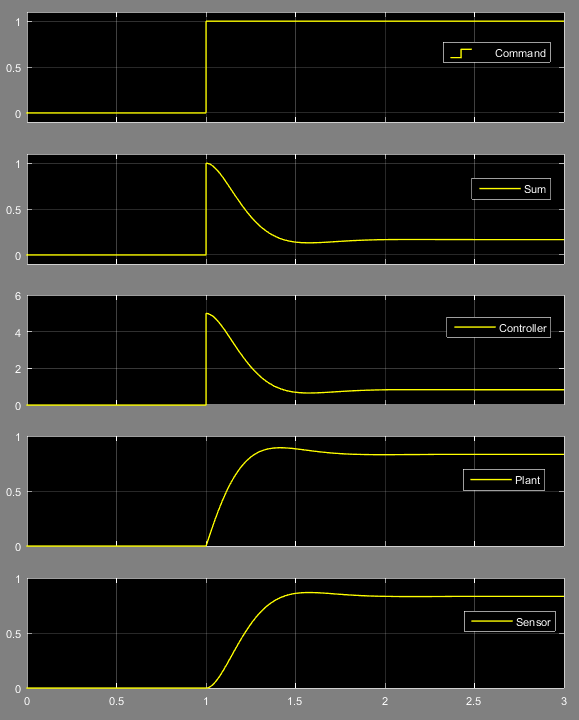
Example E.g., the picture below shows all signals for a simple system.
Plant - a single pole system with 1 rad/s bandwidth.
Controller - a proportional controller with gain of 5.
Sensor - a single pole system with 10 rad/s bandwidth.
Simulink model and results are shown below.
Note - the same block diagram can be simulated online in our web-based simulator.
Further Reading
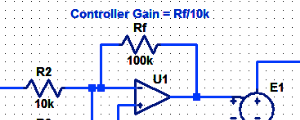
Proportional Controller Implementation
In MatLab, DSPs, and FPGAs.
.
Control System Block Diagram
The fundamentals of signal flow.
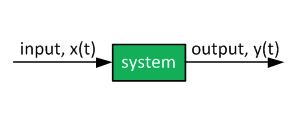
System Modeling With Transfer Functions
Introduction to dynamic systems.
Fourier Series Demo
It is all sine waves.